Plot confusion matrix in R using ggplot2 - Calculate Accuracy Assessment and Kappa Coefficient
Confusion matrix
Confusion matrix represents the difference between the actual and predicted classifications of a model. It is used to easily recognize how often a classification system mislabels one classification as another.
Packages used :
* library(ggplot2)
* library(scales)
* library(caret)
* library(dplyr)
* library(viridis)
Open data
In R, we can read data into various file formats like csv, excel, xml etc. In this video, we will learn how to read data from a csv file. The file should be present in current working directory so that R can read it. Of course, we can also set our own directory and read files from there.
data <- read.csv("C:/Users/AE/Desktop/DATA GGPLOT2/ConMatrix/ConMatrix.csv")
View(data)
View(data)
> as. factor () function in R Programming Language is used to convert the passed object (usually Vector) into a Factor. Parameters: Object: Vector to be converted.
data$GrndTruth <- as.factor(data$GrndTruth)
data$Classified <- as.factor(data$Classified)
data$Classified <- as.factor(data$Classified)
What is the function of confusion matrix in R ?
In R Programming the Confusion Matrix can be visualized using confusionMatrix function which is present in the caret package. where, data – a factor of predicted classes. reference – a factor of classes to be used as the true results.
CFMatrix <- confusionMatrix(data$GrndTruth, data$Classified)
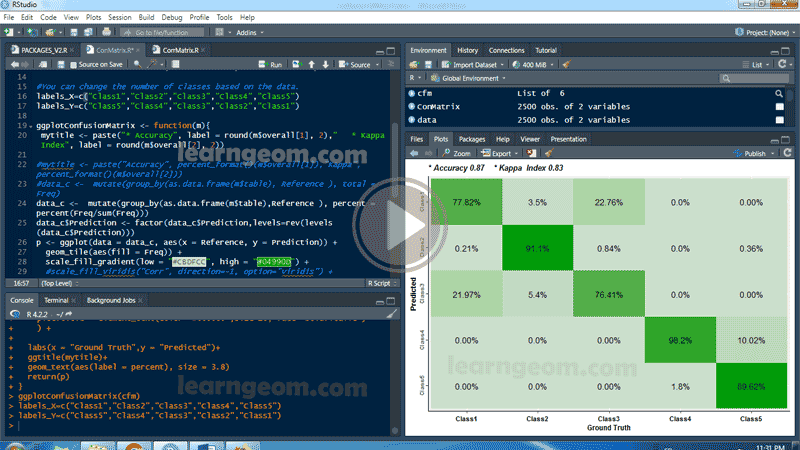
Plot confusion matrix using ggplot2
The script below is ready for use, but you can change:
- Accuracy and kappa index ;
- scale fill ;
- scale x discrete labels ;
- scale y discrete labels ; - geom text display : percent or total
Open data
data <- read.csv("C:/Users/AE/Desktop/DATA GGPLOT2/ConMatrix/ConMatrix.csv")
View(data)
as.factor function
data$GrndTruth <- as.factor(data$GrndTruth)
data$Classified <- as.factor(data$Classified)
Confusion matrix
CFMatrix <- confusionMatrix(data$GrndTruth, data$Classified)
You can change the number of classes based on the data.
labels_X=c("Class1","Class2","Class3", "Class4", "Class5")
labels_Y=c("Class5","Class4","Class3", "Class2", "Class1")
Plot confusion matrix using ggplot2
ggplotConfusionMatrix <- function(m){
mytitle <- paste("* Accuracy", label = round(m$overall[1], 2)," * Kappa Index", label = round(m$overall[2], 2))
data_c <- mutate(group_by(as.data.frame(m$table), Reference ), total = Freq)
data_c$Prediction <- factor(data_c$Prediction,levels = rev(levels(data_c$Prediction)))
p <- ggplot(data = data_c, aes(x = Reference, y = Prediction)) +
geom_tile(aes(fill = Freq)) +
scale_fill_gradient(low = "#CBDFCC", high = "#04990D") +
scale_x_discrete(expand = expansion(add = 0.54),labels=labels_X)+
scale_y_discrete(expand = expansion(add = 0.55),labels=labels_Y)+
theme(axis.title.x = element_text(face="bold",size=9, hjust=0.5),
axis.title.y = element_text(face="bold",size=9, hjust=0.5,color ="#000000"),
axis.text.x = element_text(face ="bold",size =8, color="#000000"),
axis.text.y = element_text(face ="bold",size=7.8,angle=90,hjust=0.5),
axis.line = element_line(linewidth = 0.4, linetype = "solid"),
legend.position = "none",
plot.title = element_text(color="#000000",size=10, face="bold.italic")) +
labs(x = "Ground Truth",y = "Predicted")+
ggtitle(mytitle)+
geom_text(aes(label = percent), size = 3.8)
return(p)
}
ggplotConfusionMatrix(CFMatrix)
Save plot
ggsave("C:/Users/User/Desktop/CMLU.png", width= 9,height =10, units ="cm",dpi=300)
Watch the video on YouTube
